How to Apply A-Weighting: From the Octave-Band Table to a Real Noise Dose
Every noise formula on the CIH exam assumes you already know how to apply a frequency-weighting correction — but almost nothing explains it step by step. This page does: what A/C/Z-weighting actually are, the real correction table, a worked octave-band example, and then a full multi-machine scenario that chains frequency weighting into distance correction, source combination, and a real OSHA-vs-ACGIH dose comparison.
A raw dB reading and a dBA reading are not the same number — the gap between them is the frequency-weighting correction, and it depends on which frequency the noise is actually at. Get the order right: weight each source first, then combine them — never the other way around. Below, that exact method is applied to a full worked scenario: three machines, real distances, and a genuine OSHA-vs-ACGIH dose comparison that lands well under 100% for both standards, even though the combined noise level at the workstation is above 85 dBA.
What A/C/Z-Weighting Actually Are
The human ear isn't equally sensitive to every frequency — a 50 Hz rumble and a 2,000 Hz tone at the exact same raw sound pressure don't sound equally loud. Frequency weighting corrects a raw sound-level reading so the number reflects that.
- A-weighting — attenuates low and very high frequencies to match human hearing sensitivity. This is the standard filter for occupational noise dose (dBA) and what every dosimeter uses for compliance measurements.
- C-weighting — much flatter, only attenuating the extreme low and high ends. Used mainly for peak/impulse noise, not everyday dose.
- Z-weighting — zero correction. The raw, unweighted sound level.
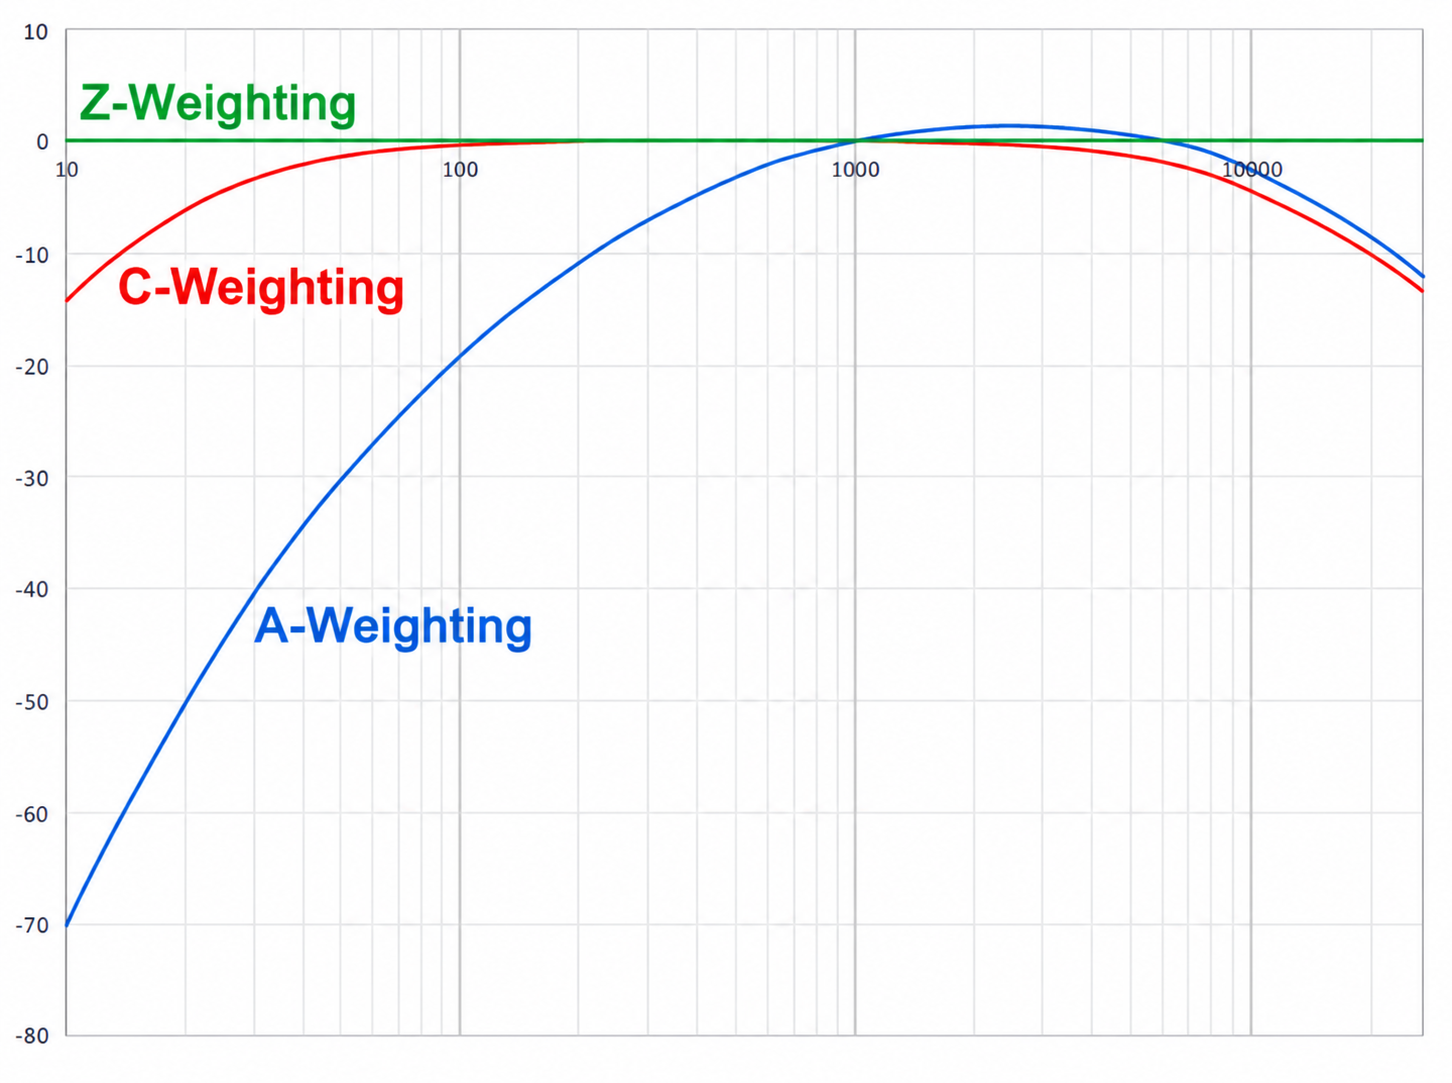
Notice A-weighting doesn't just subtract everywhere — between roughly 1,000 and 6,000 Hz it actually adds a small positive correction, because the human ear is slightly more sensitive in that range than at 1,000 Hz itself. That detail matters later in this page.
The Octave-Band Correction Table
This is the actual table you apply the correction from — one row per standard octave-band center frequency:
| Hz | 8 | 16 | 31.5 | 63 | 125 | 250 | 500 | 1,000 | 2,000 | 4,000 | 8,000 | 16,000 |
|---|---|---|---|---|---|---|---|---|---|---|---|---|
| A-weighting | -77.8 | -56.7 | -39.4 | -26.2 | -16.1 | -8.6 | -3.2 | 0.0 | +1.2 | +1.0 | -1.1 | -6.6 |
| C-weighting | -17.7 | -8.5 | -3.0 | -0.8 | -0.2 | 0.0 | 0.0 | 0.0 | -0.2 | -0.8 | -3.0 | -8.5 |
Source: NTi Audio — Frequency Weightings for Sound Level Measurements (Octave Band Weighting Factors table).
Example 1 — Applying the Table to an Octave-Band Reading
An octave-band analyzer measures a machine at three frequencies: 86 dB at 500 Hz, 92 dB at 1,000 Hz, and 94 dB at 2,000 Hz. What is the total sound level on the A-scale?
Notice the order: each band gets weighted at its own frequency before anything is combined. Summing the raw readings first and weighting the result afterward is not valid — the three bands don't share one correction value.
Example 2 — A Real Multi-Machine Workstation
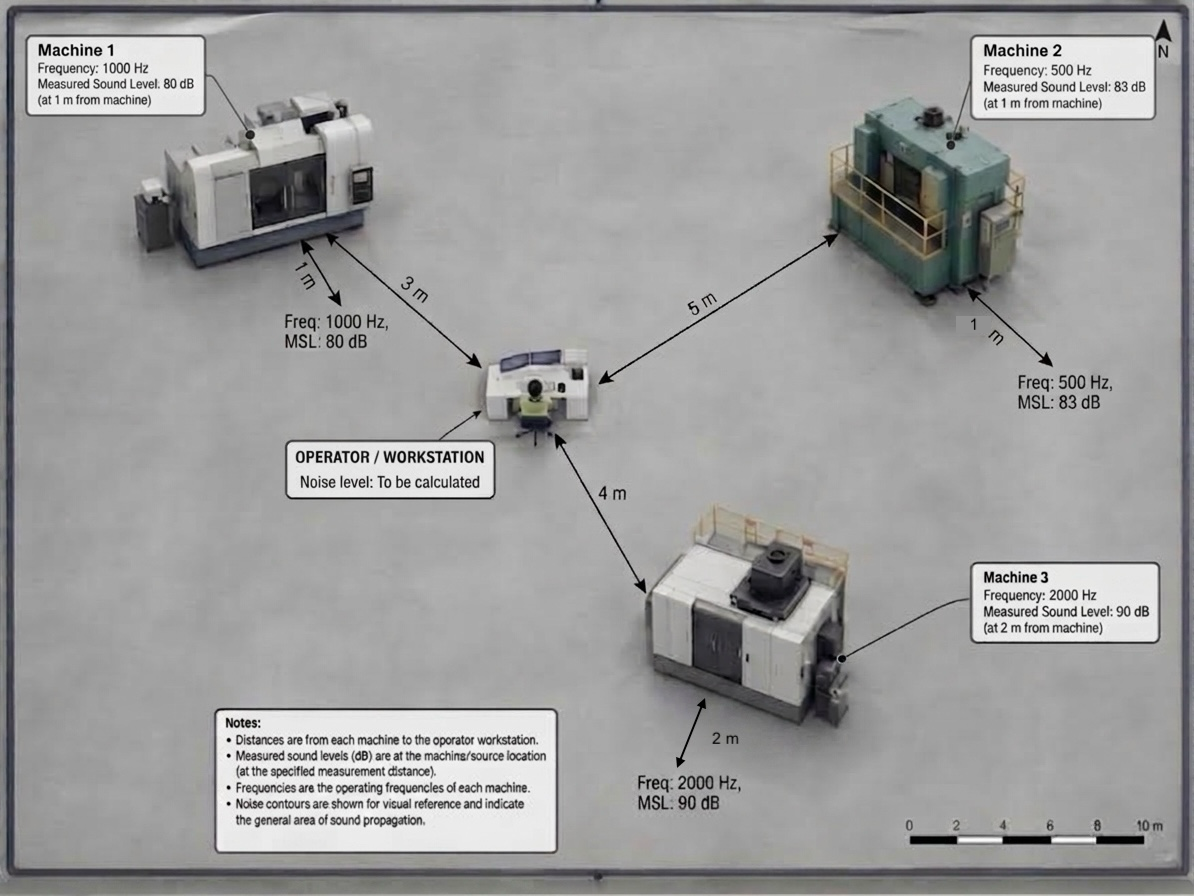
Three machines surround one operator's workstation. Machine 1 operates at 1,000 Hz, measures 80 dB at 1 m, and sits 3 m from the operator. Machine 2 operates at 500 Hz, measures 83 dB at 1 m, and sits 5 m from the operator. Machine 3 operates at 2,000 Hz, measures 90 dB at 2 m, and sits 4 m from the operator. What is the combined noise level at the operator's workstation?
| Machine | Freq. | Distance-corrected | A-weighted | C-weighted |
|---|---|---|---|---|
| M1 | 1,000 Hz | 70.46 dB | 70.46 + 0.0 = 70.46 dBA | 70.46 + 0.0 = 70.46 dBC |
| M2 | 500 Hz | 69.02 dB | 69.02 − 3.2 = 65.82 dBA | 69.02 + 0.0 = 69.02 dBC |
| M3 | 2,000 Hz | 83.98 dB | 83.98 + 1.2 = 85.18 dBA | 83.98 − 0.2 = 83.78 dBC |
The two filters give meaningfully different numbers — about 1.3 dB apart — because A and C don't treat 500 Hz and 2,000 Hz the same way. From here on, this page continues with the A-weighted numbers only. These are continuous, steady-state machine sources — not impact or impulse noise (a hammer strike, a gunshot) — and A-weighting is the standard filter for continuous-noise dose calculations, matching what OSHA and ACGIH dose formulas and real dosimeters actually use. C-weighting exists mainly for peak/impulse measurements, which isn't the situation here.
85.4 dBA sits right at the ACGIH 85 dBA action level — a genuinely borderline case, and exactly the kind of number worth pushing further into an actual dose calculation.
Turning It Into a Real Dose — OSHA vs. ACGIH
85.4 dBA is a snapshot assuming all three machines run continuously together. In reality, each machine only runs for part of the shift:
- Machine 1 — runs 20 min every hour across the 8-hr shift → 8×20 min = 160 min ≈ 2.67 hr
- Machine 2 — runs twice during the shift, 45 min each time → 90 min = 1.5 hr
- Machine 3 — runs continuously except a 2-hr stoppage mid-shift → 6 hr
| Machine | A-weighted level | OSHA $T_p$ ($L_C$=90, ER=5) | ACGIH $T_p$ ($L_C$=85, ER=3) |
|---|---|---|---|
| M1 | 70.46 dBA | 120.09 hr | 230.19 hr |
| M2 | 65.82 dBA | 228.49 hr | 672.47 hr |
| M3 | 85.18 dBA | 15.61 hr | 7.67 hr |
| Machine | Actual runtime | OSHA dose | ACGIH dose |
|---|---|---|---|
| M1 | 2.67 hr | 2.67/120.09 × 100 = 2.22% | 2.67/230.19 × 100 = 1.16% |
| M2 | 1.5 hr | 1.5/228.49 × 100 = 0.66% | 1.5/672.47 × 100 = 0.22% |
| M3 | 6 hr | 6/15.61 × 100 = 38.44% | 6/7.67 × 100 = 78.18% |
OSHA PEL (90 dBA, 5 dB exchange)
ACGIH TLV (85 dBA, 3 dB exchange)
Neither standard is exceeded — but ACGIH's dose is nearly double OSHA's for the exact same real exposure. That's not a rounding artifact; it's the direct consequence of ACGIH's stricter 85 dBA / 3 dB criteria versus OSHA's more lenient 90 dBA / 5 dB criteria, applied to the same time-weighted data.
⚠ The Mistake to Avoid
Look back at the combined level from Example 2: 85.4 dBA — above the ACGIH 85 dBA criterion. It would be easy to assume that automatically means the dose exceeds 100%. It doesn't — the dose came out to 79.6%. The combined level is a snapshot assuming every source runs simultaneously and continuously; actual dose time-weights each source by how long it's really present. A combined or peak reading above the criterion level does not by itself tell you the dose is over — always run the actual time-weighted dose calculation before concluding a worker is overexposed.
One More Layer — Adding a Fan
Machine 3 runs hot, and the area has poor ventilation, so the plan is to add an industrial cooling fan near the operator. The fan itself adds noise — the question is where to place it so the operator's total ACGIH dose still doesn't cross 100%.
Fan spec: 10 blades, 3,600 RPM, measured 89.5 dB at 1 m, running 20 min every 2 hours across the shift.
Worth noticing why this fan matters at all when the earlier one (600 RPM, blade-pass frequency 100 Hz) barely would have: at 100 Hz, A-weighting cuts nearly 19 dB off the reading, making that fan almost irrelevant to dose at any distance. At 600 Hz, the correction is only about 2 dB — the fan's real hearing-risk contribution depends heavily on where its dominant tone lands on the weighting curve, not just how loud it reads on a meter.
Practice These Formulas Yourself
Sound Pressure and Distance, Total Level, Permissible Time, Dose Percentage, Frequency (Rotating Machinery) — every formula used on this page is a full equation card in the CIH Equation Master, with its own derivation and worked practice problems.
Try the CIH Equation Master →Radiation equations are free to try — no sign-up required
A-Weighting & Noise Dose — Frequently asked questions
What is the difference between A-weighting, C-weighting, and Z-weighting?
A-weighting attenuates low and very high frequencies to approximate how the human ear perceives loudness, and is the standard filter for occupational noise dose (dBA). C-weighting is much flatter, attenuating only the extreme low and high ends, and is typically used for peak/impulse noise measurements. Z-weighting applies no frequency correction at all — it is the raw, unweighted sound level.
Do I apply the frequency-weighting correction before or after combining multiple noise sources?
Before. Apply the correct A-weighting value to each source at its own frequency first, then combine the weighted levels using the Total Level (logarithmic sum) formula. Combining first and weighting afterward is not valid, since each source may sit at a different frequency with a different correction.
Why can a combined noise level above 85 dBA still result in a dose under 100%?
A combined sound level is a snapshot assuming every source is present at once. Actual daily dose time-weights each source by how long it is actually running. If no single source (or their overlap) persists for the full 8-hour shift, the time-weighted dose can be well under 100% even though an instantaneous combined reading exceeds the criterion level. Always calculate dose from actual exposure durations — never judge compliance from a peak or combined reading alone.
Why does the same noise scenario produce a different dose under OSHA versus ACGIH?
OSHA uses a 90 dBA criterion level with a 5 dB exchange rate; ACGIH uses a stricter 85 dBA criterion level with a 3 dB exchange rate. The smaller exchange rate means ACGIH's allowable exposure time drops faster as sound level rises, so identical real-world noise data will generally produce a meaningfully higher dose percentage under ACGIH than under OSHA.